Crude Oil Market Dynamics 2019
OTC published a series of three articles in early 2015 on the international crude oil market and price (Putter & Buys, 2015). This article is an update and follow-up on the 2015 articles.
We thought now would be an opportune time to give an update on what transpired in the oil markets over this intermediate period of 4½ years and take stock of what this might mean for oil markets into the future. Readers who have not read the original articles are encouraged to do so. This article builds on information provided in those articles and we’ve tried to eliminate unnecessary repetition where possible.
Introduction
The previous series of articles (Putter & Buys, 2015) were written shortly after the collapse in oil prices from above $100/bbl in middle 2014 to $45/bbl in early 2015. Eventually the oil price decreased to below $30/bbl in early 2016, before gradually recovering to the current level of between $60 and $70/bbl.
The oil market and oil pricing into the future is highly relevant to the liquid fuel and petrochemical industry, especially as far as project investments are concerned. Projects in these industries are very capital intensive and medium to long term oil pricing is critical in the assessment of these project investments.
Developments since the previous articles necessitated an update and follow-up, especially considering the recent attacks on Saudi Arabia oil facilities and the ongoing global environmental protests against fossil fuels. Current oil market dynamics are similar to the situation in early 2015.
In this article more information is provided on those factors impacting the oil market, with emphasis on those that have undergone changes over the past five years. The factors covered are:
- Climate change and energy needs;
- OPEC influence;
- USA shale oil;
- Political impact and social unrest;
- Conventional oil supply constraints; and
- Upstream investment.
Oil price
The article starts with an update on oil pricing and some pointers on future oil pricing are provided under the closing remarks.
A graph showing the oil price from 1861 to 2018 is available in the BP Review of World Energy 2018 (BP, 2019). This graph showed periods of stability, but mostly demonstrated the high level of volatility in the oil price over its history. For this discussion, we’ll focus on the oil price fluctuations over the past 10 years, as shown in Figure 1.

Figure 1: WTI oil price from 2009 to 2019 in $/bbl (Macrotrends, 2019)
Reaching extremes of $26/bbl and $110/bbl over the last 10 years, the oil price continued to exhibit the high volatility experienced since the Yom Kippur War in 1971. There is no reason to believe that this volatility will stop anytime soon. All the factors driving the volatility remain in place.
The rest of the article focuses on the factors impacting the oil market, especially those factors where some change has occurred over the past five years.
Climate change and energy needs
Over the past five years there has been further global acknowledgement of climate change and the role that fossil fuels are playing in such climate change. This is witnessed by the Paris Agreement signed in 2016 which aims to contain the rise in global average temperature to 1.5 °C above pre-industrial levels. By middle 2019, 195 members of the United Nations had signed the Paris Agreement.
Despite this increased focus on oil’s contribution to carbon dioxide (CO₂) emissions, there has not been any noticeable change in the patterns of oil consumption. Since the 2015 articles, the global oil consumption has grown from 93 million bbl/day to 100 million bbl/day by the end of 2018. This growth over four years was slightly higher than the upper end of the range predicted previously of 1 to 1.5 million bbl/day growth per year. The main reason for this growth in oil demand is the growth in world energy demand and the inability of renewable energy to provide this additional demand at present. This is illustrated in Figure 2, showing global primary energy consumption over the past 25 years.

Figure 2: Global primary energy consumption (BP, 2019)
It is clear from Figure 2 that the world’s energy demand is still growing strongly (by 2.9% in 2018). As shown in the previous series of articles, this energy demand is closely related to global GDP. While the global GDP is on the increase (mainly driven by developing nations such as China and India), the energy demand also grows. With renewable energy still only a small proportion of overall energy needs, even the spectacular growth of renewable energy cannot yet supply the incremental growth in energy needs, and the demand for fossil fuels will grow into the foreseeable future.
The constraints in growth of renewable energy is clearly demonstrated in Figure 3, which shows the relative fractions of global primary energy supply. Despite the emphasis on renewable energy over the past 20 years, its contribution to global energy needs has still not reached 5%. Over the past 10 years the annual growth in renewable energy has approximately been 15% per annum. To reach a contribution of 20% to global energy needs (a level at which 15% annual growth in renewable energy should satisfy the annual incremental growth in total global energy needs) will take another 15 to 20 years.
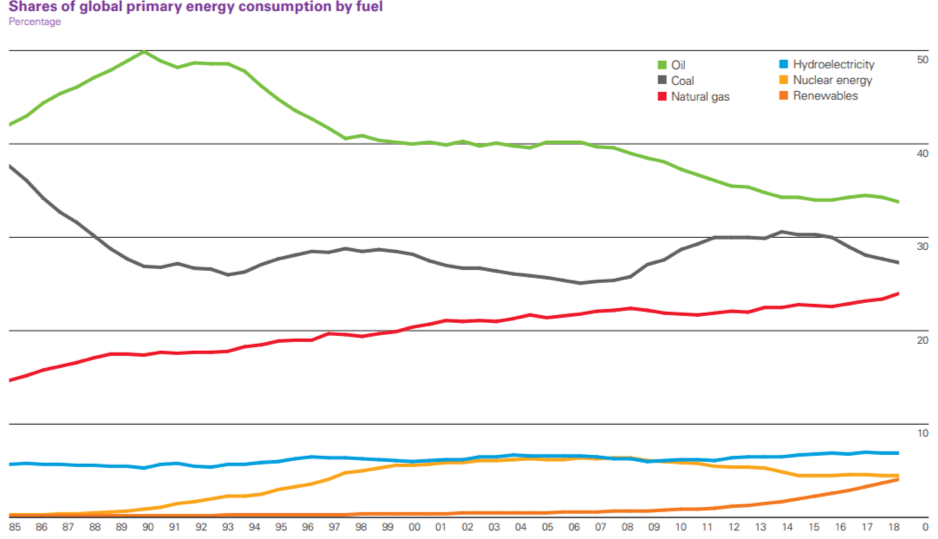
Figure 3: Shares of primary energy consumption (BP, 2019)
Amongst the fossil fuels, most of the environmental pressure is on coal, and the consumption of coal has now roughly stabilised (with peak consumption probably achieved in 2013), with noticeable decreases in coal consumption expected by 2030. The bulk of the world’s coal demand is consumed in electricity production, and the growth in electricity demand (3.7% in 2018) is currently made up from growth in gas consumption (overall gas demand grew by more than 5% in 2018) and growth in renewable electricity (14.5% growth in 2018, but off a low base).
Very little oil, or oil derivatives, is used for electrical power production and therefore oil demand is not much impacted by coal consumption decreases. Oil mostly finds its way into the transportation industry, and today oil-derived fuels still dominate this industry. Some replacement by natural gas is occurring and a lot of publicity is given to the fledgling electric car industry (with the electrical power for these electric cars then presumably generated from renewable energy sources). This also highlights another important perspective on oil consumption relative to greenhouse gases: two factors must be simultaneously in place to reduce CO₂emissions from oil:
- The number of electric vehicles must grow exponentially in replacing internal combustion engines, and
- The electricity for these electric vehicles must predominantly come from renewable energy.
It would not contribute to greenhouse gas emission reduction if all internal combustion engines are being replaced by electric vehicles, but the electrical power for these electric vehicles come from coal-fired power stations, or even gas-fired power stations. Similarly, ineffective would be the situation where all electricity is generated from renewable sources, but there is little or no replacement of internal combustion vehicles by electric vehicles.
An important aspect of environmental pressure on fossil fuels emerging over the past couple of years, concerns the investment in fossil fuel companies and financing of fossil fuel projects by international financial groups. This culminated in the launching of the Principles for Responsible Banking on 22 September 2019 (UNEP, 2019). The objectives of this initiative is probably best summarised in the words of the Executive Director of UNEP: “A banking industry that plans for the risks associated with climate change and other environmental challenges can not only drive the transition to low-carbon and carbon-resilient economies, it can benefit from it. When the financial system shifts its capital away from resource-hungry, brown investments to those that back nature as solution, everybody wins in the long term” (DBP, 2019). Up to now, these Principles for Responsible Banking have been signed by about 130 international financial groups including Barclays, Citigroup, UBS, ABN Amro, Eurobank, Deutsche Bank, ING, and BNP Paribas. Amongst the 30 banks that led the development of the Principles for Responsible Banking were two South African banks, namely Standard Bank and FirstRand.
It is becoming increasingly clear that it will be very difficult to achieve the objectives of the Paris Agreement on Climate Change by relying exclusively on renewable energy growth and improvements in energy efficiency. Examples of additional measures that could make a contribution to reduce the CO₂ concentration in the atmosphere, are nuclear power generation, the “greening” of the planet to absorb more CO₂ into vegetation, and the capturing (before or after emission) of CO₂ and sequestration thereof. Successes with either of the last two options could bring some relief to the increasing pressure on fossil fuels.
OPEC influence
The Organisation of the Oil Exporting Countries (OPEC) remains a strong influence in global oil supply and plays an important role in balancing oil supply and demand. Over the past 5 years the percentage of oil supplied by OPEC has decreased somewhat with the amount of oil supplied today (roughly 30 million bbl/day) unchanged from five years ago, but the overall global supply having grown from 93 to 100 million bbl/day.
Compared to the production of five years ago, there has been some movements in the production of the individual OPEC members. Today there is significantly less oil produced by Iran (close to 3 million bbl/day less), and Venezuela (about 1.5 million bbl/day less). Both declines are as a result of politics and sanctions, but there is a difference in that Iran’s oil production can quickly recover in case of sanctions being lifted, while Venezuela’s oil industry has suffered permanent damage and will take many years to recover. These declines have largely been made up from increases in Iraqi oil production (about 1.5 million/day) and higher utilisation of the capacity of Saudi Arabia, UAE and Kuwait. The net result is that OPEC today has appreciably less excess capacity in their system than was available in middle 2014.
The biggest impact of OPEC over the past five years was the attempt from late 2014 to early 2016 to slow down the development of the shale oil industry in the USA by flooding the world market with oil and forcing oil prices down. The impact of this is clear from Figure 1, with oil prices crashing from over $100/bbl to less than $30/bbl within the space of 18 months. In early 2016, OPEC reverted to their traditional approach of reducing output to balance the supply demand balance of the market. The experiment of flooding the market with oil had a limited impact on the growth in the USA shale oil industry, but had a longer-term impact in reducing the oil price. Even today there is still an overhang of oil stocks built up during that period. Additionally, the period of low oil prices has discouraged many oil development investments and the impact of that is still to be seen into the future.
Another result of the OPEC overproduction from end 2014 until early 2016, is that there is today appreciably more cooperation between OPEC and some non-OPEC members in balancing the world oil market. This is especially significant in the case of Russia, one of the three large oil producers in the world. Nowadays Russia often attends OPEC meetings and cuts back oil production in consultation with OPEC (mainly Saudi Arabia). This has contributed significantly in stabilising the oil markets after the turmoil of the oversupply period.
Over the past five years there have been some changes to the membership of OPEC, but these are small oil producers and had a limited impact on the organisation. Currently there are 14 members (soon to reduce to 13) compared to the 12 members five years ago. The new members are Gabon (2016), Equatorial Guinea (2017) and Republic of the Congo (2018). Qatar left the organisation in early 2019 and Ecuador has announced that it will leave OPEC at the start of 2020.
Oil revenue remains the main source of income for most of the OPEC members. This revenue reduced significantly over the past five years (from $1 trillion in 2013 to less than $0.5 trillion in 2016 and $0.7 trillion in 2018), as demonstrated in Figure 4.

Figure 4: OPEC oil export revenue (IEA, 2019)
This decrease in revenue had severe impacts on most OPEC members and necessitated reactions such as shrinkage of government expenditure, reduction in social support programmes and infrastructure development, and reduction or elimination of fuel subsidies within those countries. In many cases this led to political upheaval and social unrest as clearly evidenced in Venezuela, Libya, Algeria, Nigeria, Ecuador and even to some extent in Saudi Arabia.
Saudi Arabia has had a strategy of diversifying out of its dependence on the oil industry for at least 10 years. This has led to big infrastructure and other expenditure with a high demand for capital. Especially in the light of the decreasing oil revenue as discussed in the previous paragraph, Saudi Arabia has embarked on a process of partial privatisation of its oil and related assets. Over the past couple of years, the focus has been on the listing of ARAMCO (Saudi’s national oil company), but the first transaction executed was actually the sale of SABIC (Saudi’s main petrochemical company) to ARAMCO in early 2019. Both these transactions somewhat lifted the lid on closely guarded information of the Saudi Arabia oil industry; firstly, via the initial prelisting statement of ARAMCO published in 2018 and secondly via the bond prospectus issued by ARAMCO during the financing of the SABIC transaction. Some of the more pertinent information made available, include the following:
- The royalty rate on Saudi oil production is a progressive royalty (based on Brent prices) of 20% up to $70/bbl, 40% between $70 and $100/bbl, and 50% above $100/bbl. As part of the initial purchase offering (IPO) and to boost the capitalisation value, the first royalty bracket might be reduced to 15%.
- Previously the tax rate on ARAMCO was 80%; in preparation for the IPO this has now been reduced to 50%.
- The average extraction cost of oil is $2.8/bbl and the upstream capital expenditure in 2019 equated to $4.7/bbl.
- Surprisingly, the production from Ghawar is only 3.8 million bbl/day, appreciably lower than the previously assumed 5 million bbl/day. Not only does this confirm that Ghawar (and possibly many of the other older and bigger oil fields in OPEC) have entered the declining phase of the Hubbert curve), but it also casts some doubt on Saudi Arabia’s claimed spare production capacity.
USA shale oil and other new sources of oil
By far the biggest contribution to oil supply growth in the world over the past five years has come from the USA, and predominantly from the growth in shale oil. As shown in Figure 5, the USA oil production increased by almost 7 million bbl/day, which is the bulk of the total demand growth in the world over this period. This is phenomenal growth in production and the increase from 2017 to 2018 of 2.2 million bbl/day is the largest ever annual increase by a single country and leaves the USA today (with production of over 12 million bbl/day) as the country with the largest oil production in the world.

Figure 5: USA oil production (IEA, 2019)
The bulk of this growth in USA oil production has come from shale oil production with offshore (primarily Gulf of Mexico) oil production contributing less than 1 million bbl/day. Furthermore, almost half of this growth in shale oil production came from growth in the Permian basin as demonstrated in Figure 6. The annual production in the Permian of over 4 million bbl/day also then makes the Permian basin the largest single producing oil field in the world, surpassing the 3.8 million bbl/day produced by Ghawar in Saudi
Arabia.

Figure 6: Permian oil production (IEA, 2019)
There are widely varying forecasts of future USA oil production. At the basis of this uncertainty is the high speed at which new shale oil production wells can be brought online and the exceptionally high decline rates for these shale oil wells. There seems to be consensus that shale oil production in the USA will peak at some stage, although the predicted dates for this varies from imminently, to only after 2030. Several factors will play a role here, some of them itemised below:
- Oil price: The common wisdom is that shale oil operators in the USA are losing money at current oil prices, with the industry in total never showing positive cash flow on an annual basis (mainly as a result of the fast development and high development costs);
- Consolidation of industry: Over the past several years, there has been substantial consolidation in the shale oil industry, mainly as a result of the oil majors buying out the smaller operators. The more conservative financial management of these large multinationals has slowed down the break-neck speed of shale oil development, as evidenced by the decline of the total number of drilling rigs in the USA from just below 1100 to about 850 over the past year; and
- Limit of shale oil productivity improvements: Apparently the limit of how much oil can be produced from a single well and how fast these wells can ramp up, has now been reached. Initial production rates over the first 30 days of a shale oil well’s life (IP-30 rates) were routinely increasing by up to 40% per year for most of the past decade. This has slowed to 11% in 2017, 15% in 2018 and only 2% so far in 2019. Interestingly, IP-90 rates have started declining in 2019. Reasons for this turnaround include increasing interference amongst parent-child wells; limits to the extent of horizontal drilling, fracking and sand injection; and the declining impact of initially only drilling a parent well (in order to retain a lease) followed much later by the lower-producing child wells. Parent wells typically produce 10 to 40% more oil than child wells.
In the medium term, the future of shale oil in the USA will be determined by what happens in the Permian basin. The production from Permian has not peaked yet, but Figure 6 shows that the rate of growth has slowed down. This is confirmed by Figure 7, showing the year-on-year increases for Permian.

Figure 7: Permian year-on-year growth (IEA, 2019)
Although the current information and trends do indicate an imminent slowdown in USA shale oil production growth, this can again change very quickly due to the volatile nature of this part of the oil industry. A trigger that could for example reverse the current slowdown in shale oil development, would be a significant oil price increase (to above $80/bbl for a minimum period of say a quarter). Further potential positive factors for shale oil development are other fields still to be developed in Texas, New Mexico and northern Mexico. In the rest of the world, there is limited potential for shale oil development in Argentina and China.
Over the past five years the biggest development other than shale oil, has been the deep-sea oil discovered off the coast of Guyana. The first major announcement was made in May 2015 when Exxon announced the success of the Liza well in the Stabroek block. Since then, more than 10 successful wells have been drilled in the Stabroek block with expected oil recovery from those wells at over 6 billion bbls. Earlier in 2019, a successful well was also drilled in the Orinduik block and further discoveries are expected in the Guyana Suriname basin. Exxon expects to produce more than 750 000 bbl/day of oil from the Stabroek block by 2025 with the first oil to flow in early 2020.
Political impact and social unrest
Over the past five years, politics continued to have an impact on oil supply. Many of these incidences are well-known and will not be elaborated on here. In general, this led to a reduction in oil supply and it is expected to continue to impact oil supply negatively, at least into the medium term. This includes the aftermath of the Arab Spring (still very influential in Algeria and Egypt), sanctions by the USA against Iran and Venezuela, rebuilding of Iraq oil production after two destructive wars, internal strife in Nigeria and Libya, and so on.
The political disagreement with the biggest potential impact on oil supply, is the ongoing and escalating conflict between Saudi Arabia and Iran. Up to now, this has led or contributed to the brutal war in Yemen, the breakdown in relations between Saudi Arabia and Qatar (including sanctions imposed against Qatar by Saudi Arabia and some of its Arabian allies and the resignation by Qatar out of OPEC), attacks on oil and fuel carriers travelling through the Persian Gulf and the recent attacks on oil infrastructure within Saudi Arabia. The biggest threat of this conflict is disruption of tanker traffic in the Persian Gulf through which 20% of the world’s oil supply passes.
Closely linked to political upheaval is the impact of social unrest. This was exacerbated over the past five years by the dramatic decline of the oil price through 2015 and 2016, and the resultant significant cutback on social programmes, infrastructure development and other government expenditure. A typical example of this is the recent development in Ecuador where the country’s finances deteriorated to the point where emergency funding had to be obtained from the International Monetary Fund (IMF). One of the conditions of this funding was the removal of fuel subsidies which led to a doubling of diesel prices in Ecuador and initiated substantial social unrest. Within days after the start of the social unrest, Ecuador’s normal oil production of close to 550 000 bbl/day had been reduced by 300 000 bbl/day, Ecuador declared force majeure on all its oil export contracts, and Ecuador announced its intention to resign out of OPEC. Since then an agreement has been reached between the government and the protesters to stop the protests in exchange for the discontinuation of the implemented austerity measures, but this is not a permanent solution.
Conventional oil supply constraints
As highlighted in the 2015 set of articles (Putter & Buys, 2015), it seems like conventional oil production (defined as on-land and in shallow water up to 200m deep) has peaked at about 80 million bbl/day. This peak was already reached in 2005 and currently conventional oil production is still close to this peak. This extended plateau is made possible by OPEC’s actions to contain oil supply (with almost all of OPEC’s oil supply originating from conventional oil). At some stage the decline in conventional oil production will commence and put substantial pressure on unconventional oil sources to meet global demand.
The 7 million bbl/day growth in demand of oil over the period 2014 to 2018 was all supplied by unconventional oil. The bulk of this growth was supplied by USA shale oil (2.7 million bbl/day) and deepwater oil (1.4 million bbl/day) as shown in Figure 8. Also clear from this graph is that Rodger (2019) expects this growth in shale oil and deepwater production to continue for at least another four years.

Figure 8: Shale oil and deepwater oil output (Rodger, 2019)
Other major contributions to unconventional oil supply over this four-year period came from biofuels (roughly 1 million bbl/day), natural gas liquids (1.9 million bbl/ day) and tar sands crude (0.3 million bbl/day). The contribution from tar sands was low due to limits imposed by the Alberta government on crude production in 2018 in order to relieve some pressure on the outgoing logistics systems.
Another factor causing increasing concern regarding future conventional oil supplies, is the resource replacement ratio. As shown in Figure 9, the replacement ratio for conventional oil dropped to 21% in 2018. This means that only one barrel out of every five consumed is being replaced by new resources. An even lower ratio is expected for
2019.

Figure 9: Replacement ratio conventional oil (Rystad Energy, 2019)
Upstream investment
The main reason for the dramatic decline in replacement ratio, is the limited investment in the upstream oil and gas industry. According to Wood Mackenzie (2018), the industry needs to spend at least $600 billion per annum to meet future demand, which would be an increase of over 20% on current investment levels. Other analysts such as the IEA (2019) estimate the future development cost requirement as high as $750 to $800 billion per annum, the level achieved in 2014 when the oil price exceeded $100/bbl. Figure 10 below shows the dramatic reduction in investment since then.
The long-term forecast provided in the World Oil Outlook, as shown in Table 1, seems to be representative of various other market opinions, at least until 2035. This indicates that another 10 million bbl/day of oil will need to be added to world supply over the next 15 years. Then unconventional oil supply would have to grow by at least 50% over this period. Especially since shale oil is expected to be only a fraction of this, the upstream expenditure will be much higher than has traditionally been the case. Upstream investment in sources such as deepsea oil, biofuels and heavy oil processing (tar sands or Orinoco heavy oil) are substantially higher than in the case of conventional oil.
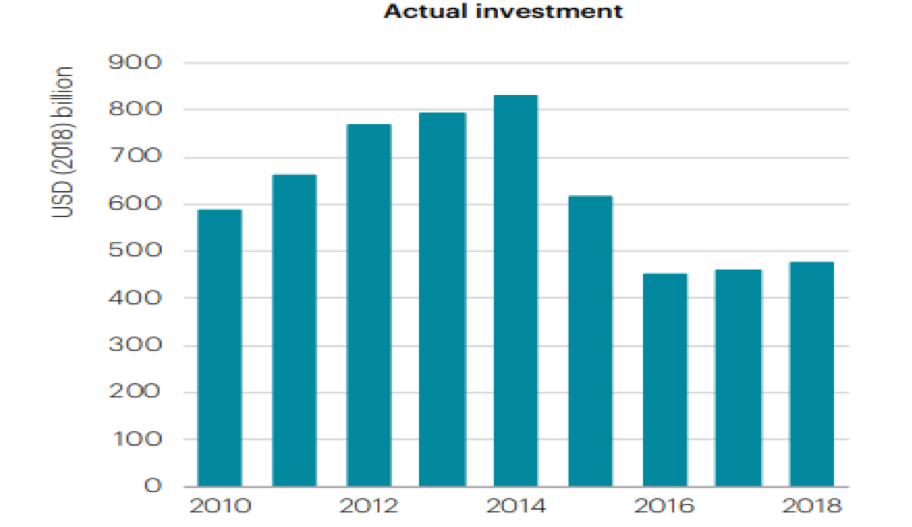
Figure 10: Investment in upstream oil and gas (IEA, 2019)

Table 1: Long-term oil supply forecast (OPEC, 2018)
Closing remarks
The crude oil industry is big and ongoing activities within the industry carries a tremendous amount of momentum. Changes to the industry occur slowly, especially as far as capacity addition is concerned. Normally the capacity utilisation within the industry is high at above 95%. This is also the reason why oil prices can be so volatile in the short term with any substantial and unexpected production interruption threatening the ability to supply demand in the short term. Furthermore, the oil market exhibits a low price-sensitivity, meaning that demand changes slowly in response to price changes.
In the short term (up to two years) the oil price might remain under pressure as a result of subdued demand growth. Currently forecasts indicate growth in 2019 to be less than one million bbl/day. Low global GDP growth and ongoing trade wars are probably the main reasons for the low oil demand growth. On the other hand, the low level of spare capacity in oil production could lead to spikes in oil price if there are major supply disruptions. As long as these oil disruptions are short term in nature (less than one or two months), these price spikes should also be short term in nature.
In the medium to longer term (two years up to ten years) the risks to the oil price seem to be on the upside. The planning for supply growth (as typically shown in Table 1) seems to be based on a set of ideal condition for both oil demand containment and oil supply. Any of several developments deviating from these ideal conditions could lead to an oil shortage and high oil prices for a sustained period:
- Oil demand growth might not be as slow as predicted resulting from climate change efforts. Several developments could contribute to this underestimation, i.e. rate of growth of electric vehicles, more effective carbon capture and storage, lack of external financing driving up oil prices, and a faster decline in coal, or a slower increase in natural gas growth, than anticipated which drives up demand for oil;
- Conventional oil supply starts declining at significant rates and insufficient non-conventional oil investments are in place to counter this;
- Shale oil supply growth in the USA does not continue at the estimated high rates for the next five years, as currently estimated;
- Climate activists prevent the required investment in unconventional oil projects (and possibly even some conventional oil developments) leading to oil shortages; and
- Insufficient capital is spent on upstream oil developments for economic reasons.
Finally, there is always the possibility of a black swan event that could drive the oil price to “unimaginably high levels not seen in our lifetimes” in the words of Saudi Arabia’s Crown Prince Mohammed bin Salman (Turak, 2019). This statement was made specifically in relation to the possibility of a war between Saudi Arabia and Iran, but there are also other events that could lead to this undesirable outcome. With the USA becoming increasingly self-sufficient in oil supply and imports of crude oil from OPEC lower than at any stage over the past 50 years, the USA has less reason to ensure political stability in the Middle East, thereby increasing the probability of this black swan event.
References
- (2019) BP Statistical Review of World Energy 2019 / 68th edition. Available from https://www.bp.com/content/dam/bp/business-sites/en/global/corporate/pdfs/energy-economics/statistical-review/bp-stats-review-2019-full-report.pdf. Accessed on 30 October 2019.
DBP. (2019) DBP makes climate action and sustainability central to its business through Principles for Responsible Banking. Available from https://www.dbp.ph/newsroom/dbp-makes-climate-action-and-sustainability-central-to-its-business-through-principles-for-responsible-banking/. Accessed on 31 October 2019.
IEA. (2019) World Energy Investment, 2019 Edition. Report iea.org/wei2019, available from https://webstore.iea.org/world-energy-investment-2019 US Energy Information Administration.
Macrotrends. (2019) WTI Crude Oil Prices – 10 Year Daily Chart. Available from https://www.macrotrends.net/2516/wti-crude-oil-. Accessed on 31 October 2019.
OPEC. (2018) World Oil Outlook 2040. Report OPEC 978-3-9503936-6-8 by the Organisation of the Oil Exporting Countries.
Putter, A.H. & Buys, C.P. (2015) XTL Projects and the Oil price, Parts 1, 2 & 3. Available from https://www.ownerteamconsult.com/xtl-projects-and-the-oil-price/ Accessed on 30 October 2019.
Rodger, A. (2019) Why tight oil and deepwater are more similar than you think. Available from https://www.woodmac.com/news/feature/why-tight-oil-and-deepwater-are-more-similar-than-you-might-think/. Accessed on 31 October 2019.
Rystad Energy. (2019) All eyes on the Caribbean as replacement ratio dips to the lowest in decades.Available from https://www.rystadenergy.com/newsevents/news/press-releases/all-eyes-on-the-Caribbean-as-replacement-ratio-dips-to-the-lowest-in-decades/. Accessed on 31 October 2019.
Turak, N. (2019) Oil will hit levels ‘we haven’t seen in our lifetimes’ if Iran isn’t stopped, Saudi crown prince says. Available from https://www.cnbc.com/2019/09/30/oil-will-hit-unimaginably-high-prices-in-event-of-war-with-iran-mbs.html. Accessed on 30 October 2019,
UNEP. (2019) Principles for Responsible Banking. Available from https://www.unepfi.org/banking/bankingprinciples/. United Nations Environment Programme.
Wood Mackenzie. (2018) Upstream players need to boost spending to meet future demand. Available from (https://www.woodmac.com/press-releases/upstream-capital-investment/). Accessed on 30 October 2019.

Anton Putter
Consulting Partner
Anton holds a Chemical Engineering degree together with a number of advanced business qualifications in accounting, business economics and enterprise management. He has been closely involved with synthetic fuels ventures. More...
DOWNLOAD
You might also enjoy:

Small-scale versus Large-scale LNG Plants
By Jurie Steyn. Introduction Consumption of natural gas (NG) has grown rapidly over the past three decades and today accounts for nearly a quarter of the world’s primary energy supply. Although global primary energy consumption fell by 4,5% in 2020 due to the Covid-19...

Natural Gas for Power Generation
By Corne Thirion and Jurie Steyn Introduction The world needs an abundant supply of clean and affordable energy to support economic and social progress and build a better quality of life, particularly in developing countries. Until recently, this desire for energy has...

Outlets and Applications for Natural Gas
By Jurie Steyn Introduction South Africa’s energy sector has been in a state of insecurity for many years, and this will probably continue into the foreseeable future. Carbon emissions are high due to an over-reliance on coal as feedstock. This sets the scene for a...