
Introduction to Project Risk Management: Part 2 – Identify, analyse, action and monitor project risks
This article is a continuation of a two-part series of articles on the basics of project risk management as published previously. The two parts are as follows:
Part 1: Planning for project risk management (Steyn, 2018a); and
Part 2: Identify, analyse, action and monitor project risks (Steyn, 2018b).
In this article we delve deeper into the intricacies of quantitative analysis of the high risks to a project as identified though qualitative risk assessment.
Introduction
Project risk management covers all the activities and processes of planning for risk management, identification and analysis of project risks, response planning and implementation, and risk monitoring on a project. There are seven project risk management steps as discussed in the two articles referred to above, namely:
- Step 1 – Plan Risk Management;
- Step 2 – Identify risks and opportunities;
- Step 3 – Perform qualitative risk analysis;
- Step 4 – Perform quantitative risk analysis;
- Step 5 – Plan risk responses;
- Step 6 – Implement risk responses; and
- Step 7 – Monitor risks.
In this article, the focus will be on Step 4: perform quantitative risk analysis. We will see that quantitative risk analysis is a way of numerically estimating the probability that a project will meet its cost and time objectives. Quantitative analysis is based on a simultaneous evaluation of the impact of all identified and quantified risks, both prior to and after taking mitigating actions.
The nature of project risks
Most of our readers would be familiar with the project management triangle; a triangle with scope, cost and schedule at the three apexes, and quality in the body of the triangle. In our opinion, quality is a function of appropriate design specifications and prudent design to meet the business objectives. The scope of a project can be diligently managed and project risks should not have an impact, unless it can be shown that changes are required to address safety concerns.
Unmanaged risks may result in problems such as schedule and/or cost overruns, performance shortfall, or loss of reputation. Performance shortfalls can be addressed by redesign and improved equipment and technology, all of which require additional time and money. Reputation damage may also prove to be very costly and time consuming to overcome. Opportunities that are exploited can lead to benefits such as schedule and/or cost reductions, improved overall project performance, or reputation enhancement.
The bottom-line is that all project risks and opportunities can be expressed in terms of their impact on project schedule and project cost. Some risks will only impact cost, some only schedule, and some will directly impact both cost and schedule. However, impacts on project schedule can also be expressed in terms of monetary value, based on the extended period that contractors and construction personnel will be required and delays in beneficial operation of the facility.
Risks and opportunities can therefore have a direct bearing on the overall project schedule and project cost. By following steps 1 to 3 of the risk management process, we can identify the high priority risks and opportunities for inclusion in the quantitative risk assessment.
The nature of cost/schedule estimates
Project uncertainty changes over time. As the definition of a project advances through the project life-cycle, the level of uncertainty diminishes. This is reflected in the OTC Stage-Gate Model and gate criteria for moving from one gate to the next. The project stages provide a convenient way to characterise the state of planning and design, as well as other information about a project.
Projects in the prefeasibility stage have more unknowns than projects in the feasibility and/or planning stage. Projects moving through the implementation stage (final design and construction), in contrast, would be expected to have a comprehensive set of engineering drawings, operating assumptions, and cost detail. There could still be substantial uncertainty about certain aspects of a project well advanced in design, but most high-cost characteristics of the project will have been finalised.
Project risks and opportunities similarly change. The number of risks faced by a project would be expected to decrease as design detail advances to eliminate or avoid potential problems. Risks are also reduced as national authorities issue environmental permits and finalise other matters like tax dispensations and project subsidies.
If a project’s estimated total cost is thought of not in terms of a single dollar value, but as a potential range in costs that reflects the effects of risks and opportunities, the potential range in costs would be expected to narrow over time and converge upon a most likely value. The narrowing in cost range is shown in Figure 1.This narrowing in range is also expected for project schedule as the project moves through the stages. Note that the only time in the project life-cycle when the schedule and final cost are known with certainty, is when the facility is handed over to the end-user and the costs have been reconciliated.

Figure 1: Project cost varies with uncertainty and time (Adapted from Parsons Transportation Group, 2004)
Methodologies for quantified risk analysis
Different methods have been developed to provide realistic cost and schedule estimates over the years. Traditionally, project owners have accounted for the possible impacts of risks in a deterministic way by establishing contingencies, or add-ons, to a base project cost or base project schedule. Contingencies typically are single-value allowances and set using simple rules of thumb.
Methodologies for incorporating risk in the cost and schedule estimates include one, or more, of the following:
- Gantt Charts: Provides a graphical summary of the progress of several project segments by listing each segment vertically on a sheet of paper, representing the start and duration of each task by a horizontal line along a time scale, and then representing the current time by a vertical line moving from left to right. It is then easy to see where each task should be, and to show its status. A serious drawback is that it does not easily show the interrelationship of tasks;
- Program Evaluation Review Technique, or PERT: The basis of PERT was a detailed diagram of all anticipated tasks in a project, organised into a network, which represented the dependence of each task on the ones that needed to precede it. In addition, planners would estimate or elicit a probability distribution for the time each task would take from expert engineers.
- Critical Path Method, or CPM: CPM also uses a network representation, but initially did not try to estimate probability distributions for task durations. The deterministic nature of the network allowed for easier calculation. It facilitated the determination of the critical path, the set of tasks that drove the final project length. CPM can be used in conjunction with Monte Carlo simulation;
- Expected Monetary Value, or EMV: EMV is used in conjunction with Decision Tree Analysis (DTA). DTA allows the organisation to structure the costs and benefits of decisions when the results are determined in part by uncertainty and risk. Solution of the decision tree helps select the decision that provides the highest weighted average Expected Monetary Value or expected utility to the organisation;
- Fault Tree Analysis: A Fault Tree Analysis is the analysis of a structured diagram which identifies elements that can cause system failure. The effective application of this technique requires a detailed description of the area being discussed. The undesired outcome is first identified and then all possible conditions/failures which lead to that event are identified. This reveals potentially dangerous elements at each phase of the project.
- Sensitivity Analysis: Considered the simplest form of risk analysis and determines the effect on the whole project of changing one of its risk variables, e.g. delays in design or cost of materials. It often highlights how the effect of a single change in one risk variable can produce a marked difference in the project outcome:
- Monte Carlo simulation: Used primarily for project schedule and cost risk analysis in strategic decisions. It specifies a probabilistic distribution for each risk and then considers the effect of risks in combination. Calculates quantitative estimates of overall project risk and reflects the reality that several risks may occur together on the project.
In the further discussions, only the probabilistic approach of Monte Carlo simulation will be considered.
Monte Carlo simulation
Structure of QRA process
One first needs to understand the overall structure of the quantitative risk analysis process before getting to the detail of Monte Carlo simulation. The process illustrated in Figure 2 is aligned with the PMI standards for project management, namely the PMBOK Guide, 6th edition (PMI, 2017) and project risk management (PMI, 2009).

Figure 2: Structure of the quantitative risk analysis process (Adapted from PMI, 2017)
The process starts with the identification of significant and high risks though qualitative analysis. These risks must be examined for duplication, similarity of triggers, cost and/or schedule impacts and other interrelationships. Common root cause risks likely to occur together are addressed by correlating the risks that are related. The collection of high-quality data about risks can be difficult, because it’s not available in any historic database and should be gathered by interviews, workshops, and other means using expert judgment.
Next, an appropriate model of the project is required as the basis for quantitative risk analysis. Project models most frequently used in quantitative risk analysis include the project schedule (for time) and line-item cost estimates (for cost). Quantitative risk analysis is especially sensitive to the completeness and correctness of the model of the project that is used. This is followed by the application of the Monte Carlo process to simulate the probabilistic cost and/or schedule for the project.
Process
In a Monte Carlo analysis, deterministic cost and schedule values in the project models are replaced by probability distributions reflecting the possible range of outcomes for each of these variables. A random number generator is used to calculate a value for each of the probability distributions to produce a cost/schedule value. The same model is run repeatedly, hundreds or thousands of times. Each time it runs, the value is recorded and presented as a probability distribution. When the simulation is complete, we can look at statistics from the simulation to understand the project risk as represented in the model.
The pertinent issue is how to convert a cost/schedule range for each of the significant and high risks into a probability distribution. Risk impacts are expressed as discrete or continuous probable outcomes within a specified range, for example, with lower and upper limits for costs and/or time. The distributions are often simplified, due to the limited data points available from objective or subjective information or to be consistent with the level of accuracy that can be expected in the risk quantification effort. Probability distributions are a convenient way to represent this detail, and they lend themselves to statistical analysis.
The type of probability distribution should be chosen (e.g. by the lead analyst) to best reflect the perceived range of impacts of a risk event. Some common distributions used to characterise risks are shown in Figure 3.

Figure 3: Probability distributions for quantifying risk impacts (Parsons Transportation Group, 2004)
More accurate cost estimates
When analysing the potential effects of risk and uncertainty on project cost a project is divided into two parts. The first element is the project base cost, which is the cost excluding add-on contingencies to cover unknowns, or risks. The second element of the project includes the uncertainties and opportunities that could add to (or, in turn, subtract from) the cost of the project. This is the element of project risk.
Figure 4 shows this relationship from the perspective of project costs. Base costs tend to be large and relatively well defined. Risk costs tend to be smaller than base costs and can vary considerably. Total cost is simply the sum of these two cost elements. Base costs and risk costs are shown as distributions since, in risk assessment, both elements are uncertain. Even base costs of a project include some level of uncertainty; no two individuals would likely agree on an exact dollar number even if all assumptions were held in common.
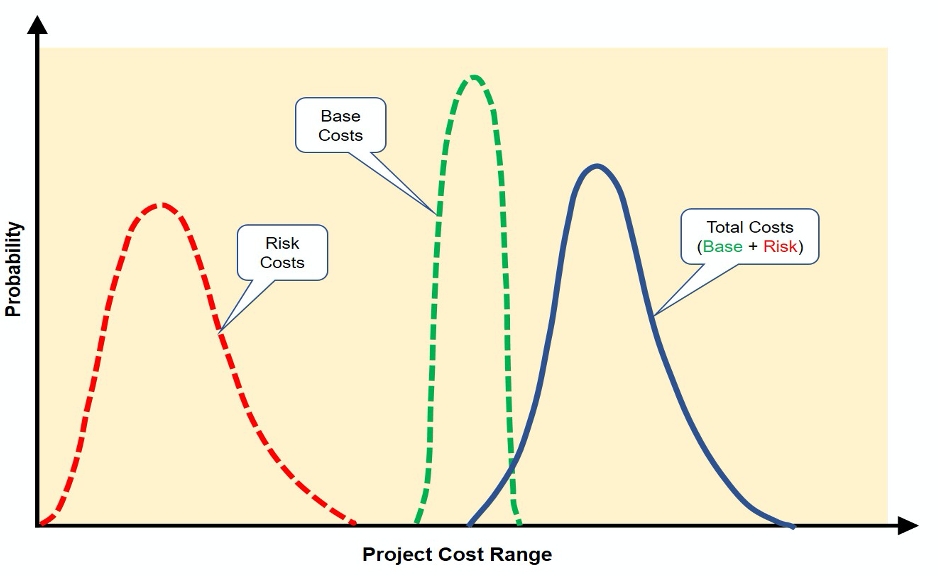
Figure 4: Base cost, plus risk cost, gives total project cost probability spread (Parsons Transportation Group, 2004)
Common cost risk assessment outputs include a probability density function of expected total cost, a cumulative S-curve of project cost, as well as a tornado diagram of primary risk drivers or events that have the most influence on the project.
More accurate project schedules
Risk assessment of a project requires three steps; first create the CPM schedule, then gather risk information such as optimistic, most likely, and pessimistic durations and probability distributions, and finally, simulate the network using a Monte Carlo approach. The greatest amount of effort and judgment goes into developing the three-point activity duration estimates to use in a schedule risk analysis.
The results of a schedule risk analysis are typically displayed as a histogram (an approximation to a probability density function) providing the frequency of schedule outcomes (dates) and an S-Curve (a cumulative distribution function) providing the cumulative probability of achieving dates associated with given milestones or overall project completion. Results for a hypothetical example are shown in Figure 5.
Other types of outputs include descriptive statistics, a probabilistic critical path, and a probabilistic sensitivity analysis. All these results should be evaluated for indicators of schedule risk.

Figure 5: Example of schedule histogram and S curve (Hulett, 2017)
Integrated cost/schedule analysis
Depending upon the nature of risks and the desired outcomes of the analysis, risk cost and schedule impacts can be evaluated independently as discussed in the preceding paragraphs, or together, in an integrated manner. The disadvantage of independent evaluation is that the interrelationship of cost and schedule cannot be determined. Integrated analysis converts duration impacts to cost impacts through escalation. It is more difficult technically, however, to evaluate cost and schedule together and may not be necessary in all cases, depending on the nature of the significant risks to a project. Analytical tools are available to assist in integrated analysis.
Pre/post risk mitigation
Using information from risk assessment, a project owner can evaluate measures to mitigate cost and schedule risks. Effective risk management will reduce impacts and make it more likely the project will be on time and within budget without the owner having to make additional contingency allowances. Effective risk mitigation will improve a project’s probable cost, as shown in Figure 6. Proposed risk mitigation is documented in a risk management plan. This becomes the project owner’s action plan for effectively minimising risk impacts to a project.

Figure 6: Comparison of project cost estimates before and after risk mitigation (Parsons Transportation Group, 2004)
Software
To determine probabilistic project costs, software such as MS Excel with @RISK™, RiskAMP™, CrystalBall™, ModelRisk™ or Deltek Acumen Risk™ can be used with any estimating method.
For schedules, software such as MS Project with @RISK™ or Risk+™, Primavera Risk Analysis software with Monte Carlo™ or Deltek Acumen Risk™ can be used. Alternatively, if a critical path schedule model can be developed in a spreadsheet, MS Excel with @RISK™, RiskAMP™, CrystalBall™ or ModelRisk™ can be used to simulate risks directly.
The result is a probability distribution of the project’s cost and completion date based on the identified risks in the project.
Concluding remarks
Proper project risk management is an integral part of any project. It is an iterative process which continues throughout the project cycle. Quantitative risk analysis is a logical next step after qualitative risk analysis and should be performed at key stages of the project life-cycle. It is a way of numerically estimating the probability that a project will meet its cost and time objectives.
Monte Carlo simulation is becoming the project manager’s best weapon for quantitatively analysing project risks. It is an extremely powerful tool that allows project managers to incorporate uncertainty and risk in their project plans and set reasonable expectations regarding cost and schedule on their projects. The results of simulation are quantified, allowing project managers to better communicate their arguments when management is pushing for unrealistic project expectations. However, Monte Carlo simulation is still not very popular in current project management practice, primarily due to its statistical nature.
For those of you looking for more information on quantitative risk analysis, I recommend the books by Cooper et al (2014), Hulett (2009) and Vose (2008).
References
Cooper, D., Bosnich, P., Grey, S., Purdy, G., Raymond, G., Walker, P. & Wood, M., 2014, Project risk management guidelines; managing risk with ISO31000 and IEC 62198, 2nd ed. John Wiley & Sons, Ltd. Chichester, West Sussex.
Hulett, D.T., 2009, Practical schedule risk analysis. Gower Publishing Limited, Farnham, Surrey.
Hulett, D.T., 2017, Modern Methods of Schedule Risk Analysis using Monte Carlo Simulations. In Proceedings of the 2017 Large Facilities Workshop, held in Baton Rouge, LA.
Parsons Transportation Group, in association with Touran, A., 2004, Risk analysis methodologies and procedures. US Dept. of Transportation, Federal Transit Administration.
PMI (Project Management Institute, Inc.), 2017, A guide to the project management body of knowledge (PMBOK Guide), 6th ed. PMI Book Service Center, Atlanta.
PMI (Project Management Institute, Inc.), 2009, Practice standard for project risk management. PMI Book Service Center, Atlanta.
Steyn, J.W., 2018a, Introduction to Project Risk Management: Part 1 – Planning for risk management. Available from http://www.ownerteamconsult.com/publications/ Accessed during May 2018.
Steyn, J.W., 2018b, Introduction to Project Risk Management: Part 2 – Identify, analyse, action and monitor project risks. Available from http://www.ownerteamconsult.com/publications/ Accessed during May 2018.
Vose, D., 2008, Risk analysis – a quantitative guide, 3rd ed. John Wiley & Sons, Ltd. Chichester, West Sussex.

Jurie Steyn
Consulting Partner, Director
Jurie holds a BEng(Chem)Hons and an MBA. He has more than 37 years of engineering, operations management and functional management experience. He started, developed and managed the Environmental & Risk Engineering group in Sasol Technology for more than 14 years. More...
DOWNLOAD
You might also enjoy:

Project Governance
By Herman van Heerden, Freek van Heerden, Jurie Steyn Introduction Ed Merrow (2011), in his book Industrial Megaprojects, maintains that much of the pathology we see in megaprojects today reflects the nature and problems of the modern industrial firm and the way in...

Black Swan Risk Management for Projects
By Jurie Steyn.Introduction Decimus Junius Juvenalis, known in English as Juvenal, was a poet active in the period AD 110 to 130. He wrote sixteen satires on the vices, abuses, and follies of Imperial Rome and is regarded by many as one of the greatest satirists of...

Learning from All Projects
Any organisation should strive for continual improvement in the way they execute projects. A good way to do this is to ensure that mistakes of the past are not repeated.